Blood Work & Lab Results Log
One page to track every lab draw across your GLP-1 journey. Record results over six visits, compare trends at a glance, and fill in personalized goal ranges with your provider. The improvements show up here first — often before the scale moves.
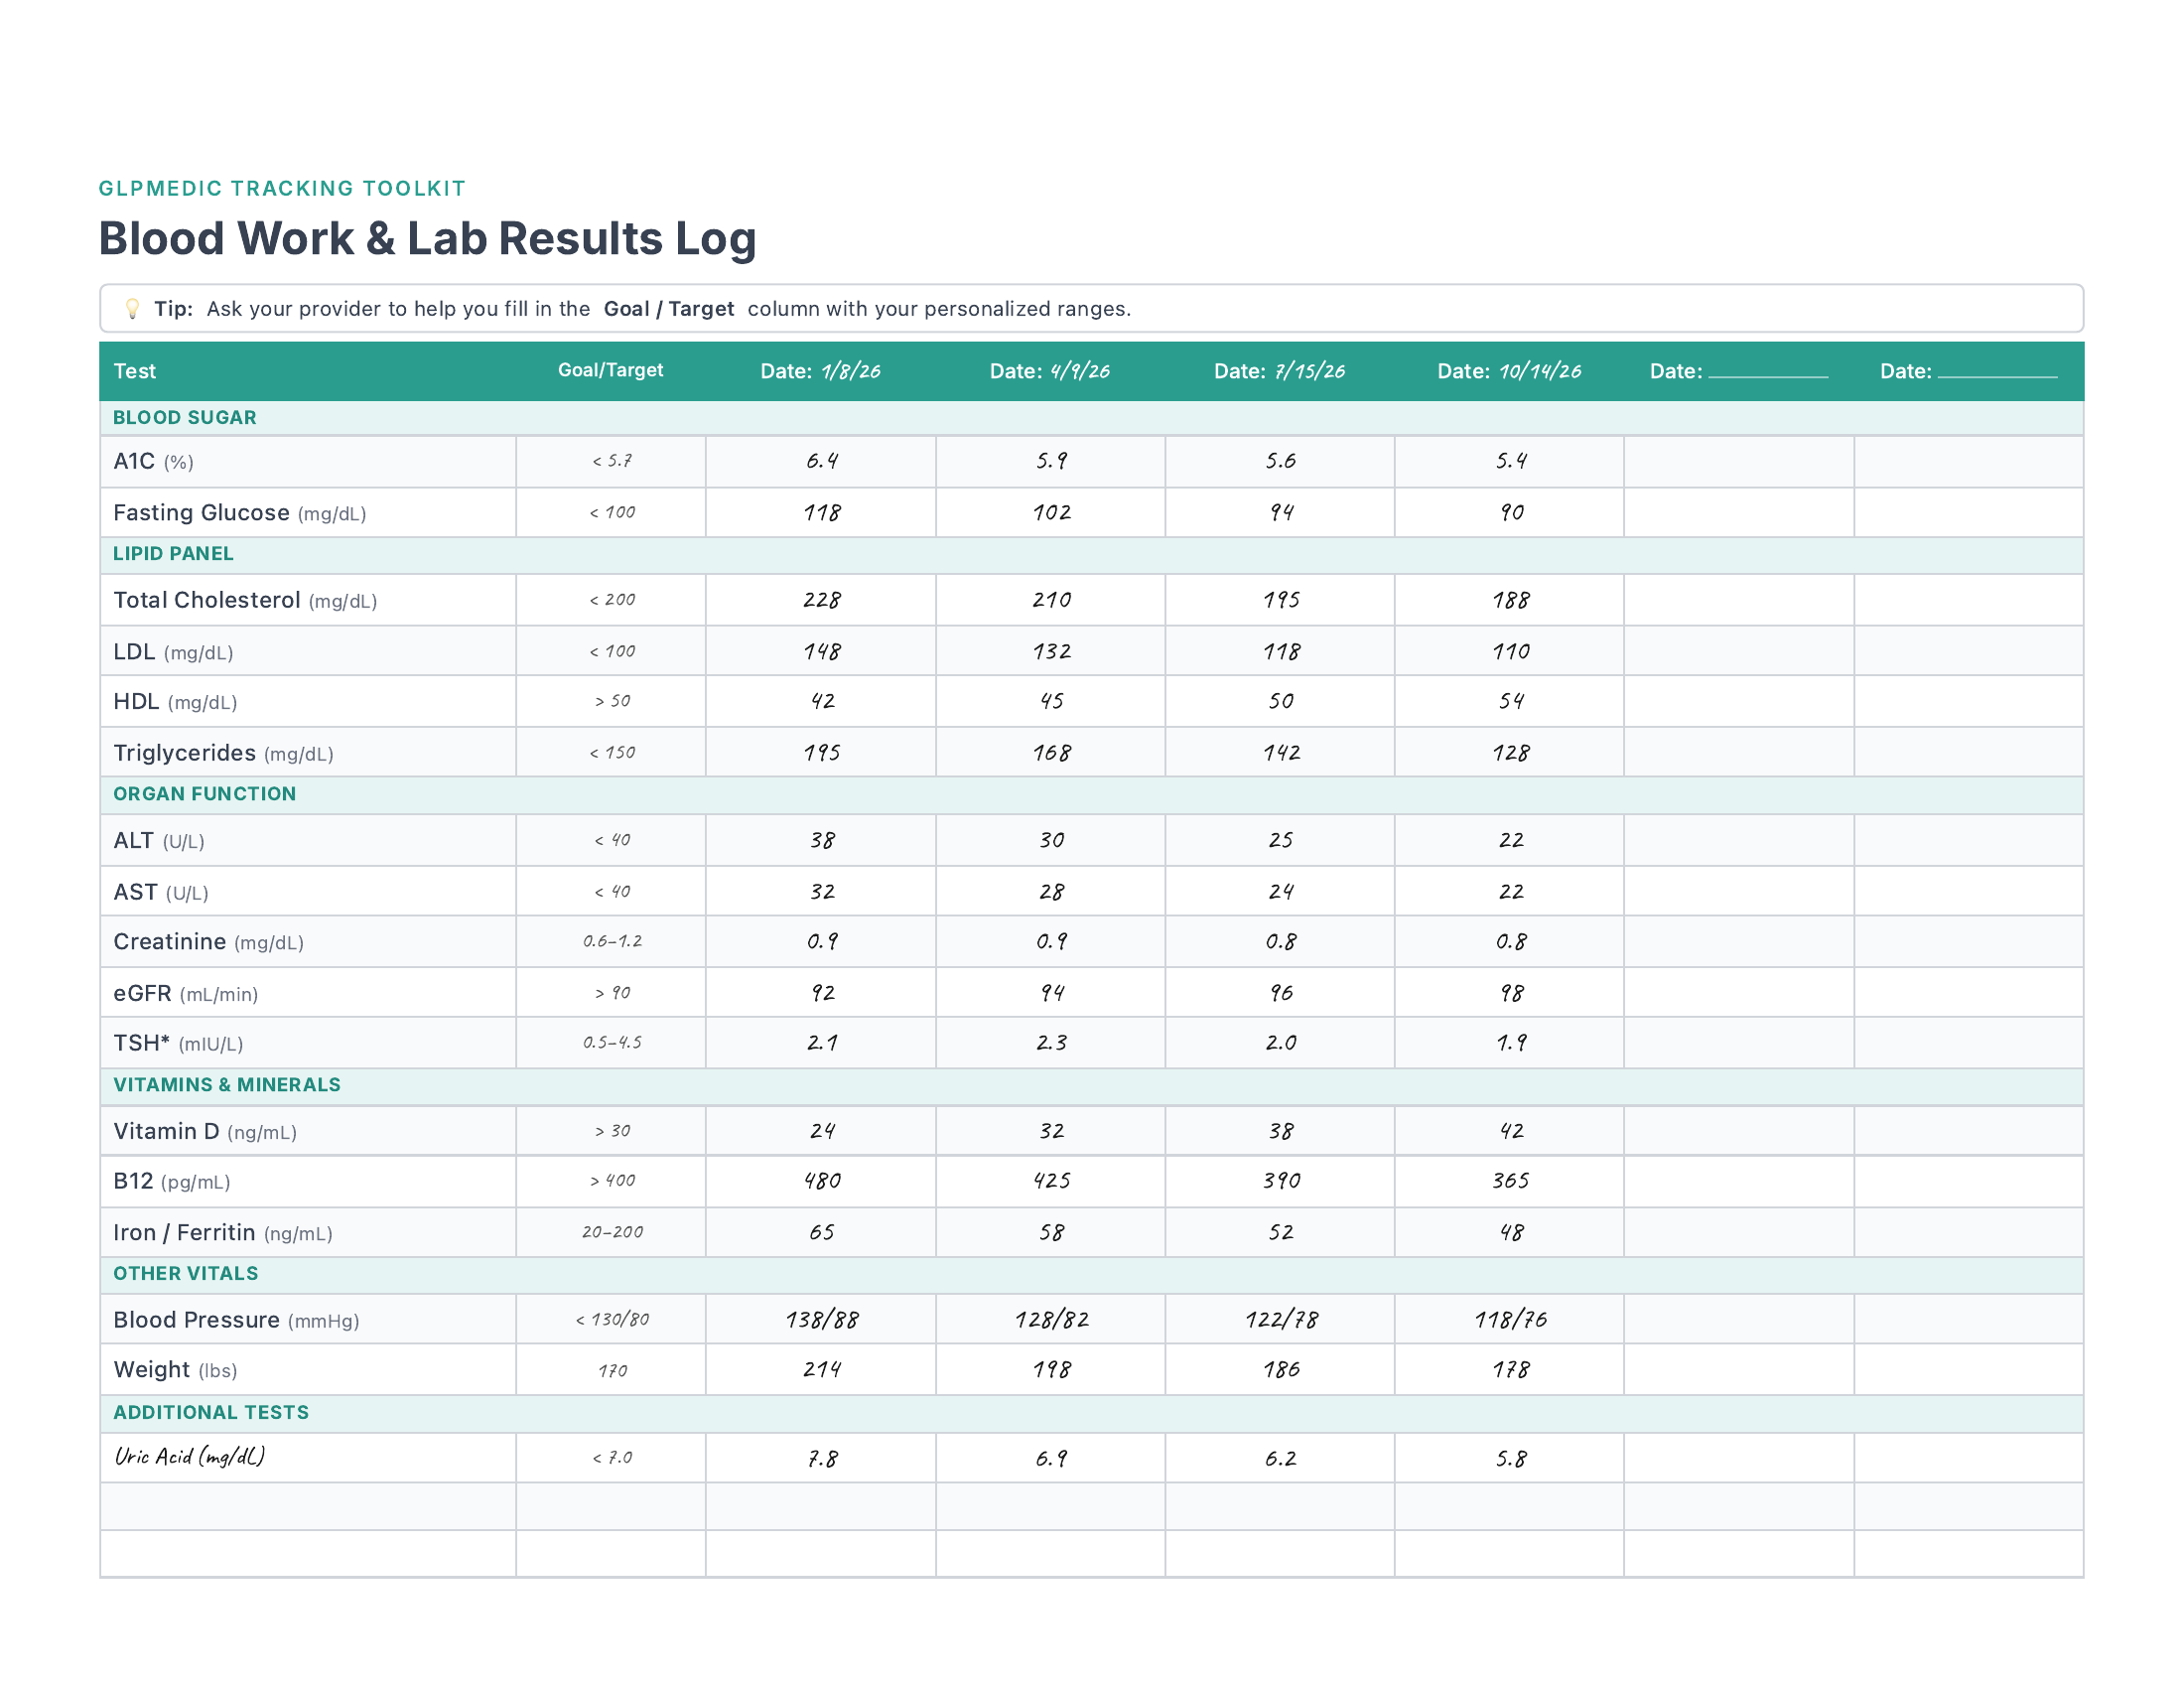
See it in action — four quarterly lab draws over 9 months. Watch A1C drop from pre-diabetic to normal, lipids improve across the board, and B12 start dipping — exactly the kind of trend you want to catch early with your provider.
What's Included
20 Pre-Labeled Tests
Blood sugar, lipid panel, liver and kidney function, thyroid (TSH), vitamins, blood pressure, and weight — all the labs your provider is likely monitoring on GLP-1 medications.
Personalized Goal Ranges
A dedicated Goal/Target column for each test. Bring this page to your next appointment and ask your provider to fill in your personalized ranges — then you'll know exactly what you're aiming for.
Six Date Columns
Room for six lab draws — enough to track 1.5 to 2 years of quarterly bloodwork on a single page. See the trend line emerge as your numbers improve over time.
Write-In Rows
Three blank rows at the bottom for any additional tests your provider orders. Everyone's lab panel is a little different — this gives you room to customize.
The first time I laid my labs side by side — baseline versus three months in — I actually got emotional. My A1C had dropped, my triglycerides were plummeting, and my blood pressure was better than it had been in years. The scale had only moved 16 pounds at that point, which felt slow. But the bloodwork told a completely different story. Your body is changing on the inside before it shows on the outside. This log is how you see it.
How to Use This Template
- 1 Start with your goals. At your next appointment, ask your provider to help you fill in the Goal/Target column with your personalized ranges. This turns abstract numbers into clear benchmarks.
- 2 Record each lab draw. Write the date at the top of a column, then fill in your results as they come back from the lab. If a test wasn't ordered that visit, leave it blank.
- 3 Read across the rows. That's where the magic is. Watching your A1C, lipids, or blood pressure trend toward your goal over three or four visits is incredibly motivating — especially during weight plateaus.
- 4 Watch for dips too. B12, iron, and vitamin D can drop when you're eating less. If you see a downward trend, that's a conversation to have with your provider before it becomes a problem.
- 5 Bring it to every appointment. Providers love patients who track their own data. This page gives your doctor a complete picture in 30 seconds.
Get the Full Tracking Toolkit
This template is just one of 23. The full bundle gives you everything you need to track your entire GLP-1 journey.
Daily & Weekly
- Daily Check-In
- Weekly View
- Weekly Reflection
- Habit Streaks
Health Monitoring
- Side Effects
- Injection Sites
- Body Measurements
- Blood Work
- Sleep
Progress & Milestones
- 8-Week Tracker
- 12-Week Dashboard
- Progress Charts
- NSV Tracker
- Clothing Timeline
Nutrition & Lifestyle
- Protein Tracker
- Meal Planning
- Food Diary
- Exercise Log
- Hydration
Planning & Reference
- Appointment Prep
- Medication Supply
- Cost Tracker
- Support Network
Bonus
- Free access to every future template — as the toolkit grows, so does your bundle. No extra cost, ever.
- Request custom templates — need something specific? Reach out to Brandon and he'll build it for you.